Prompting & Editing
This page is the complete reference for the report editor — the Create menu, prompting Agnes, what happens during generation, attachments, and view modes. If you're building your first report, start with the quick walkthrough in Get Started → Reports and come back here for the details.
The Create menu
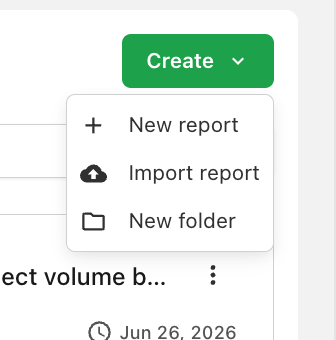
From the All reports page, select Create in the top right (the same menu is available from the ⋯ menu on All reports in the sidebar):
- New report — starts a blank report and opens it in Edit mode. If you create a report from inside a folder, it lands in that folder.
- Import report — upload an existing HTML dashboard (
.htmlor.htm, up to 15 MB). The uploaded file becomes the report's first version, and you can edit it with prompts from there. - New folder — creates a folder for organizing reports. See Organizing Reports.
Connect your data
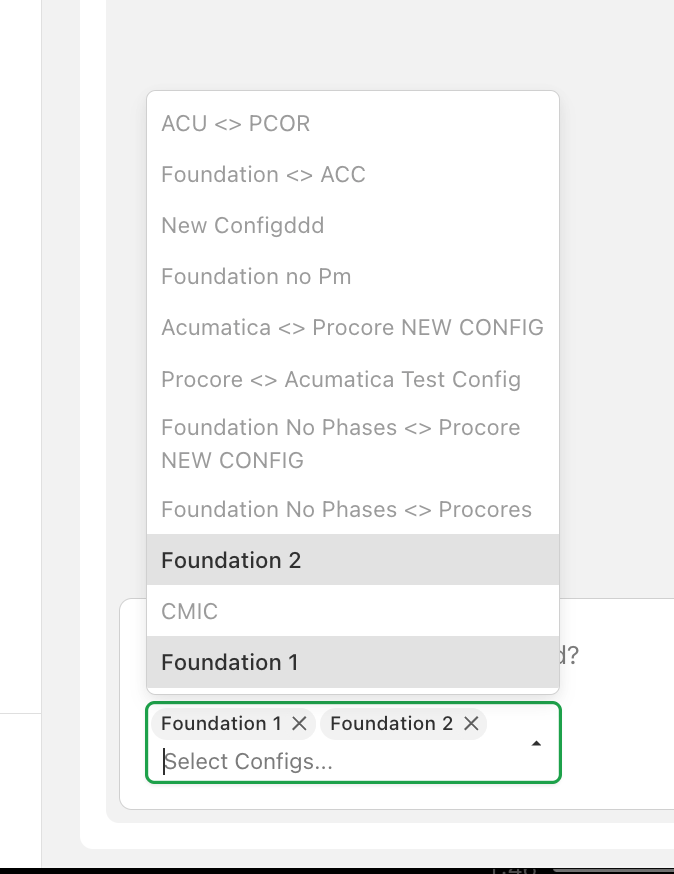
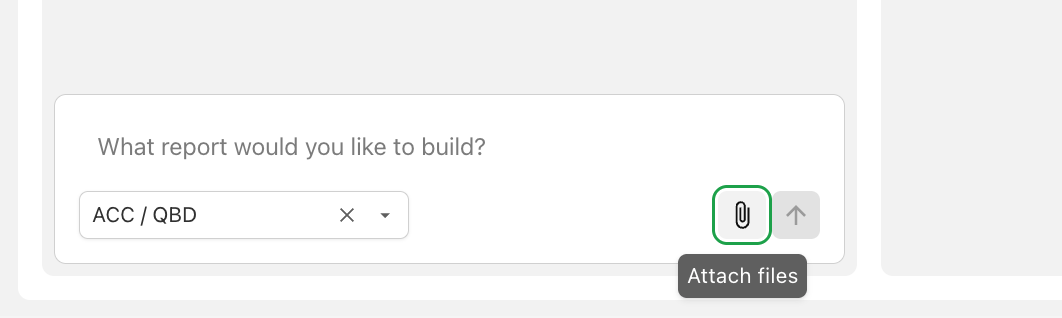
Every report is built against one or more configurations — the connections to your data. When you start a new report, a connection picker appears next to the prompt box. Pick the configurations you want, and Agnes will use that data for the life of the report.
You can connect multiple configurations to a single report — useful for reporting across several companies or accounts at once — as long as they all belong to the same source system and product. Configurations from different source systems or products can't be combined in one report.
A report's configurations are chosen when it's created and can't be changed afterward. To build the same report on different data, create a new report (or use Duplicate as a starting point).
Your first prompt
Describe the report you want in plain language in the prompt box ("What report would you like to build?"), and Agnes generates the first version of your report (v1). For tips on writing prompts that get great results, see Best Practices.
Send with the send button, or press Cmd+Enter (Ctrl+Enter on Windows). Plain Enter starts a new line, so you can write a multi-line prompt without sending it early.
Watching a report generate
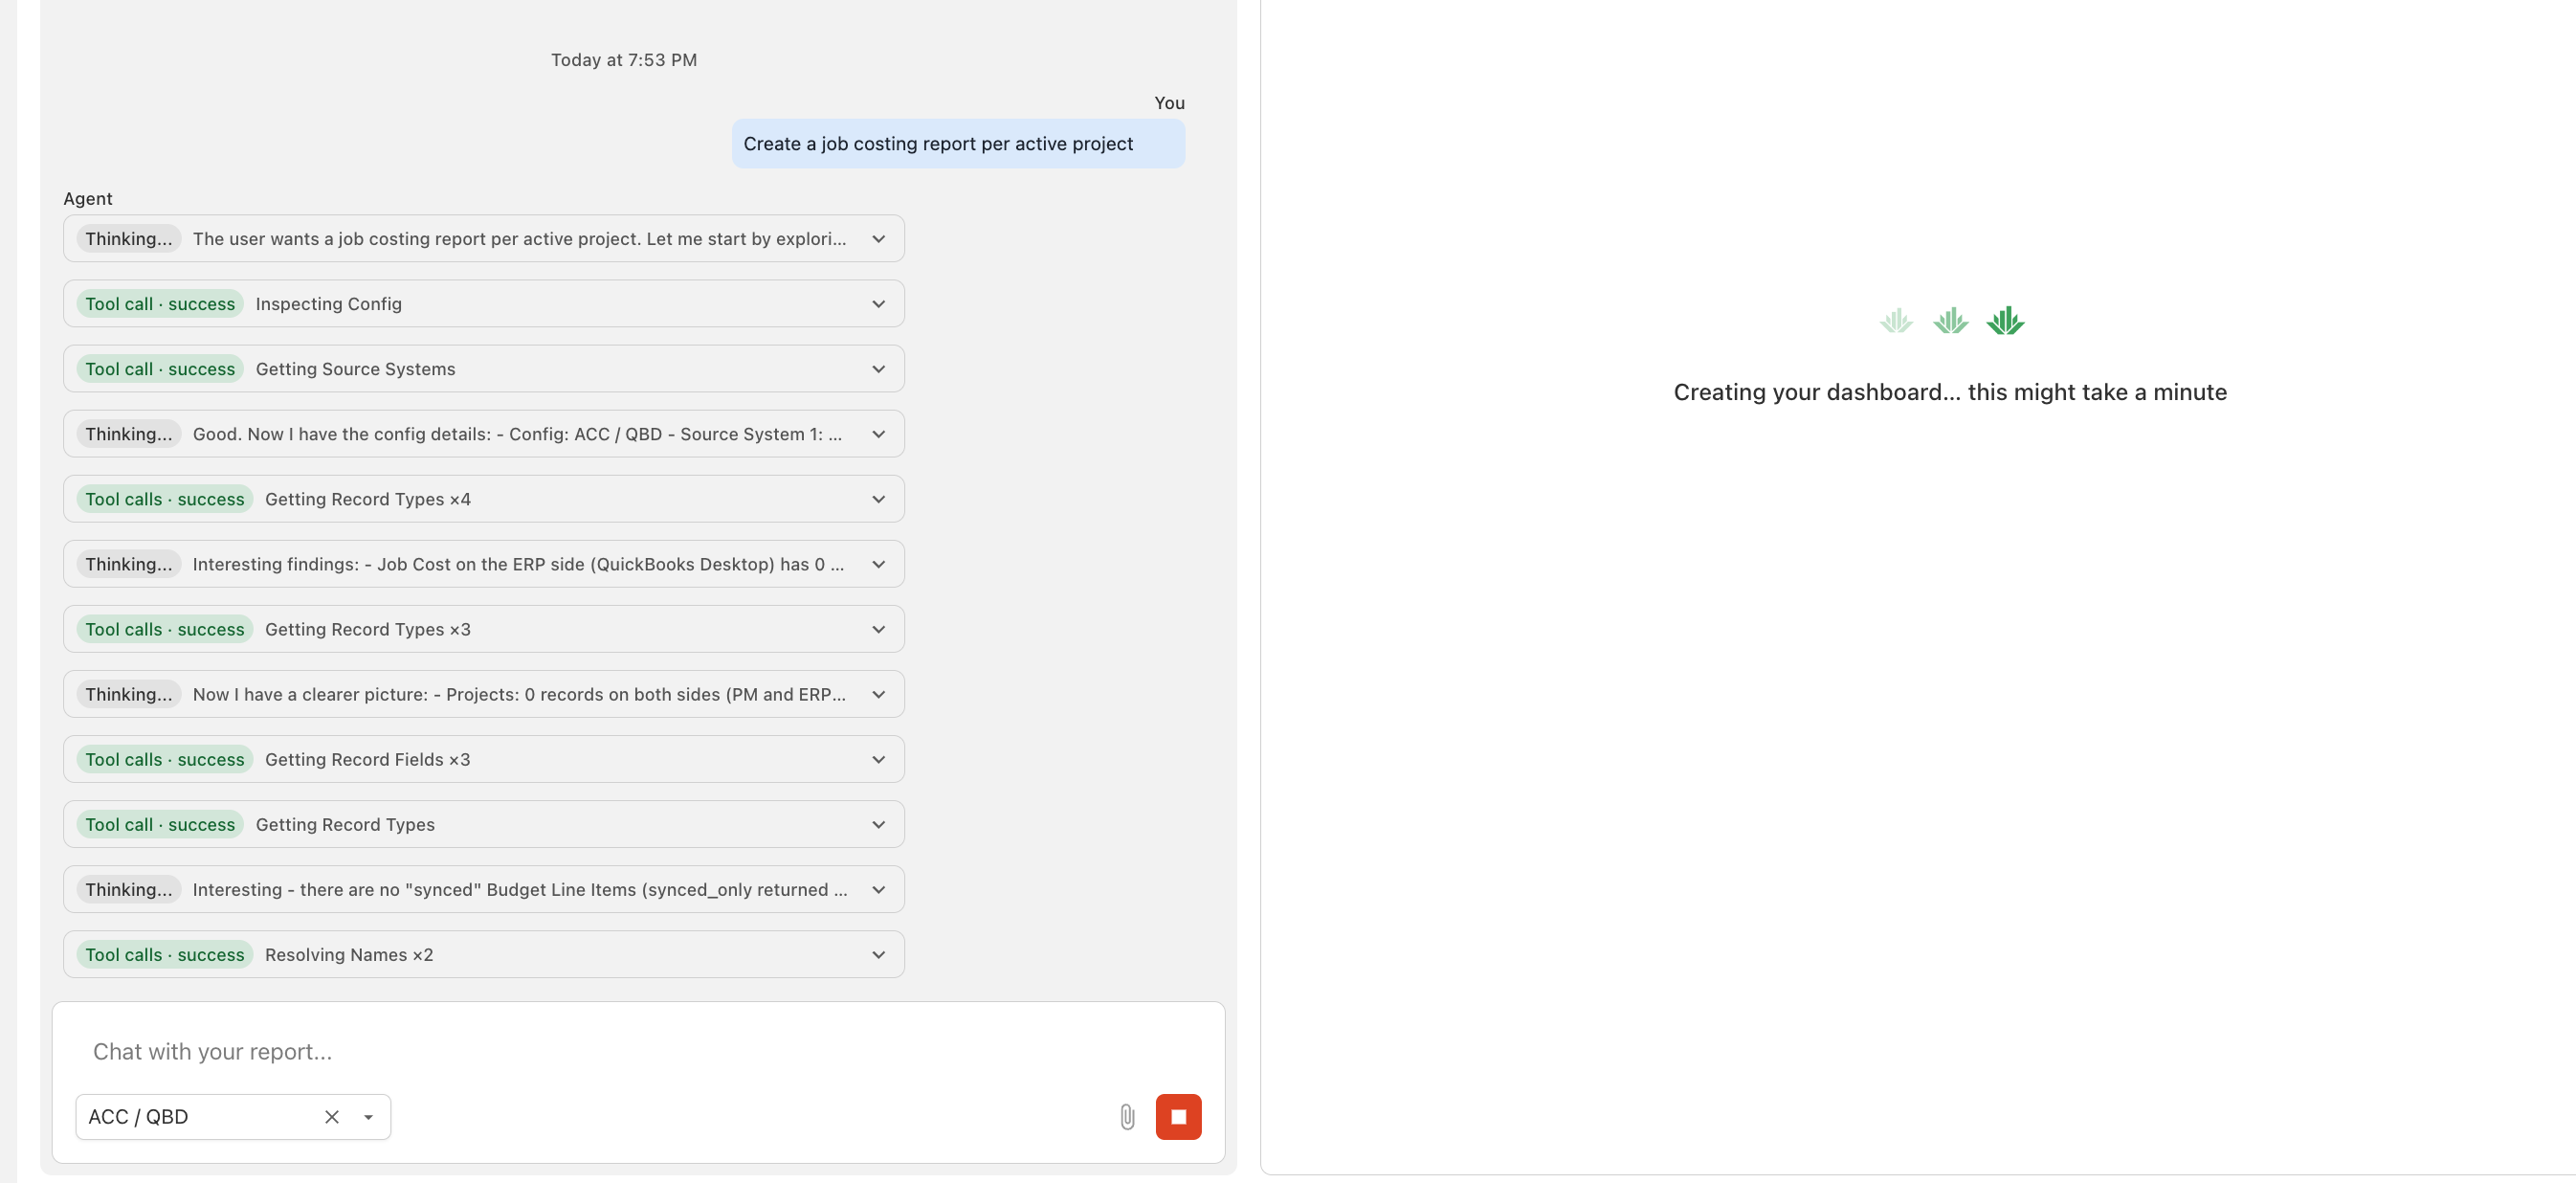
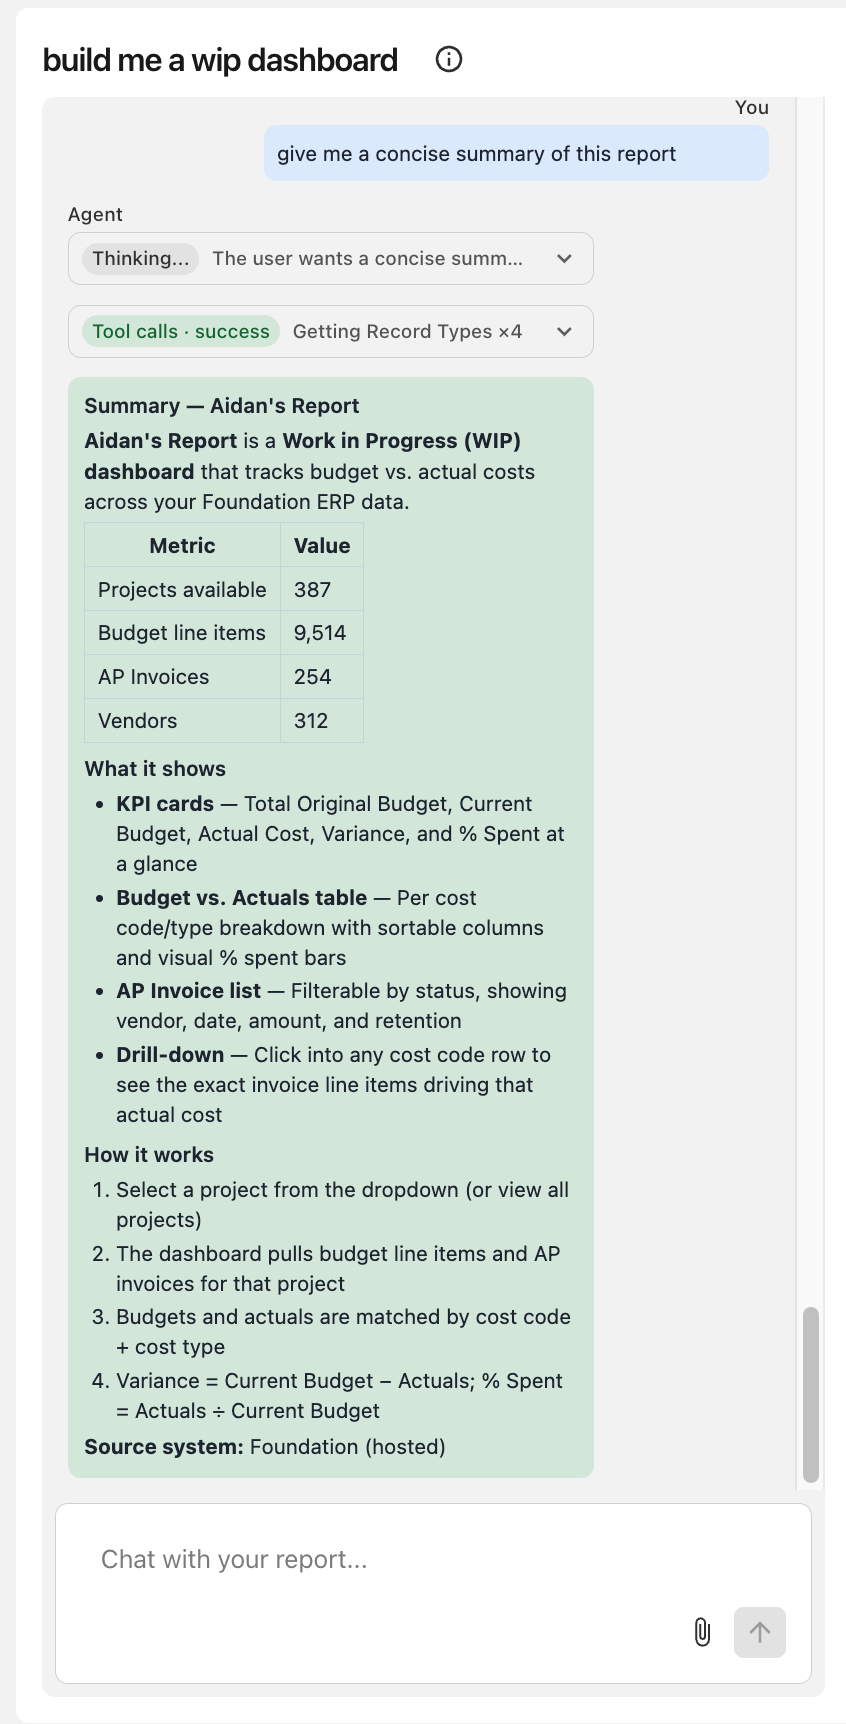
While Agnes works, the chat shows its progress live:
- Thinking blocks — Agnes's reasoning as it plans the report. These are collapsible.
- Tool calls — the steps Agnes takes to understand your data, like Getting Record Types, Getting Record Fields, or Checking Sync Status. Expand any tool call to see its arguments and output.
- The dashboard pane shows "Creating your dashboard… this might take a minute" until the report is ready.
Stopping a generation
While a report is generating, the send button becomes a Stop generating button. Stopping cancels the in-progress version and posts "Request cancelled." to the chat — the report's earlier versions are unaffected.
Follow-up prompts: edits and questions
After the first version, keep chatting with your report ("Chat with your report..."). Agnes automatically recognizes two kinds of follow-ups:
- Edits — requests to change the report ("Add a filter by project manager") create a new version.
- Questions — requests for information ("Which job has the biggest overrun?") are answered right in the chat, without creating a new version.
You don't need to choose a mode — just ask naturally. Agnes also remembers the earlier messages in the conversation, so you can refer back to things you discussed ("use the same grouping as before").
Attaching files
Select Attach files in the prompt area to give Agnes files as context — an existing report to recreate, a spreadsheet of reference data, or a screenshot of a layout you like.
- Accepted types: documents (
.pdf,.doc,.docx), spreadsheets (.xls,.xlsx,.csv,.tsv), images (.png,.jpg,.jpeg,.gif,.webp), and text files (.txt,.md,.html,.json). - Size limit: 5 MB per file.
Queued files appear as removable chips under the prompt box until you send. See Best Practices → Upload an existing report for ideas.
You can also paste a file straight into the prompt box — handy for screenshots. Pasted files are held to the same type and size rules as the dialog, and you'll see a message if one is rejected. Pasting a copied range of cells from Excel still pastes as text, not as an image.
Edit and Expanded modes
A report has two view modes, toggled in the top right:
- Edit — the chat panel on the left, the rendered report on the right. The divider between them is draggable.
- Expanded — the report on its own, full width. Great for presenting or day-to-day viewing.
People with Viewer access always see the report on its own — the chat panel and version controls are only available to Editors and Owners. See Sharing & Permissions.
The report header
The header above a report shows its name, plus:
- An info icon with the report's details — the connected configurations, owner, created and last-modified timestamps, and source systems.
- A status chip while a version is generating or has failed (for example, "Pending (v13)").
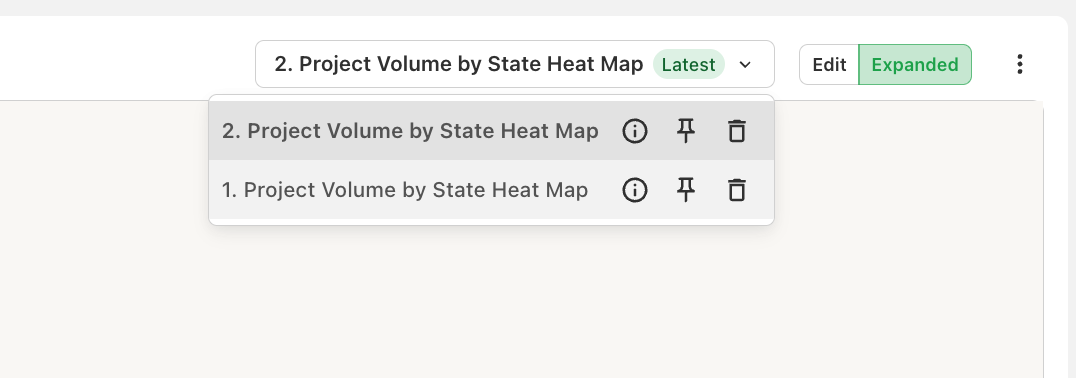
- The version dropdown for Editors and Owners — see Versions.
- The ⋯ menu with report actions — see Organizing Reports.