May 2026: Introducing AI Dashboards
Agave AI Dashboards is here. Describe the report you need in plain language, and Agnes — Agave's AI — builds an interactive dashboard from your live construction data.
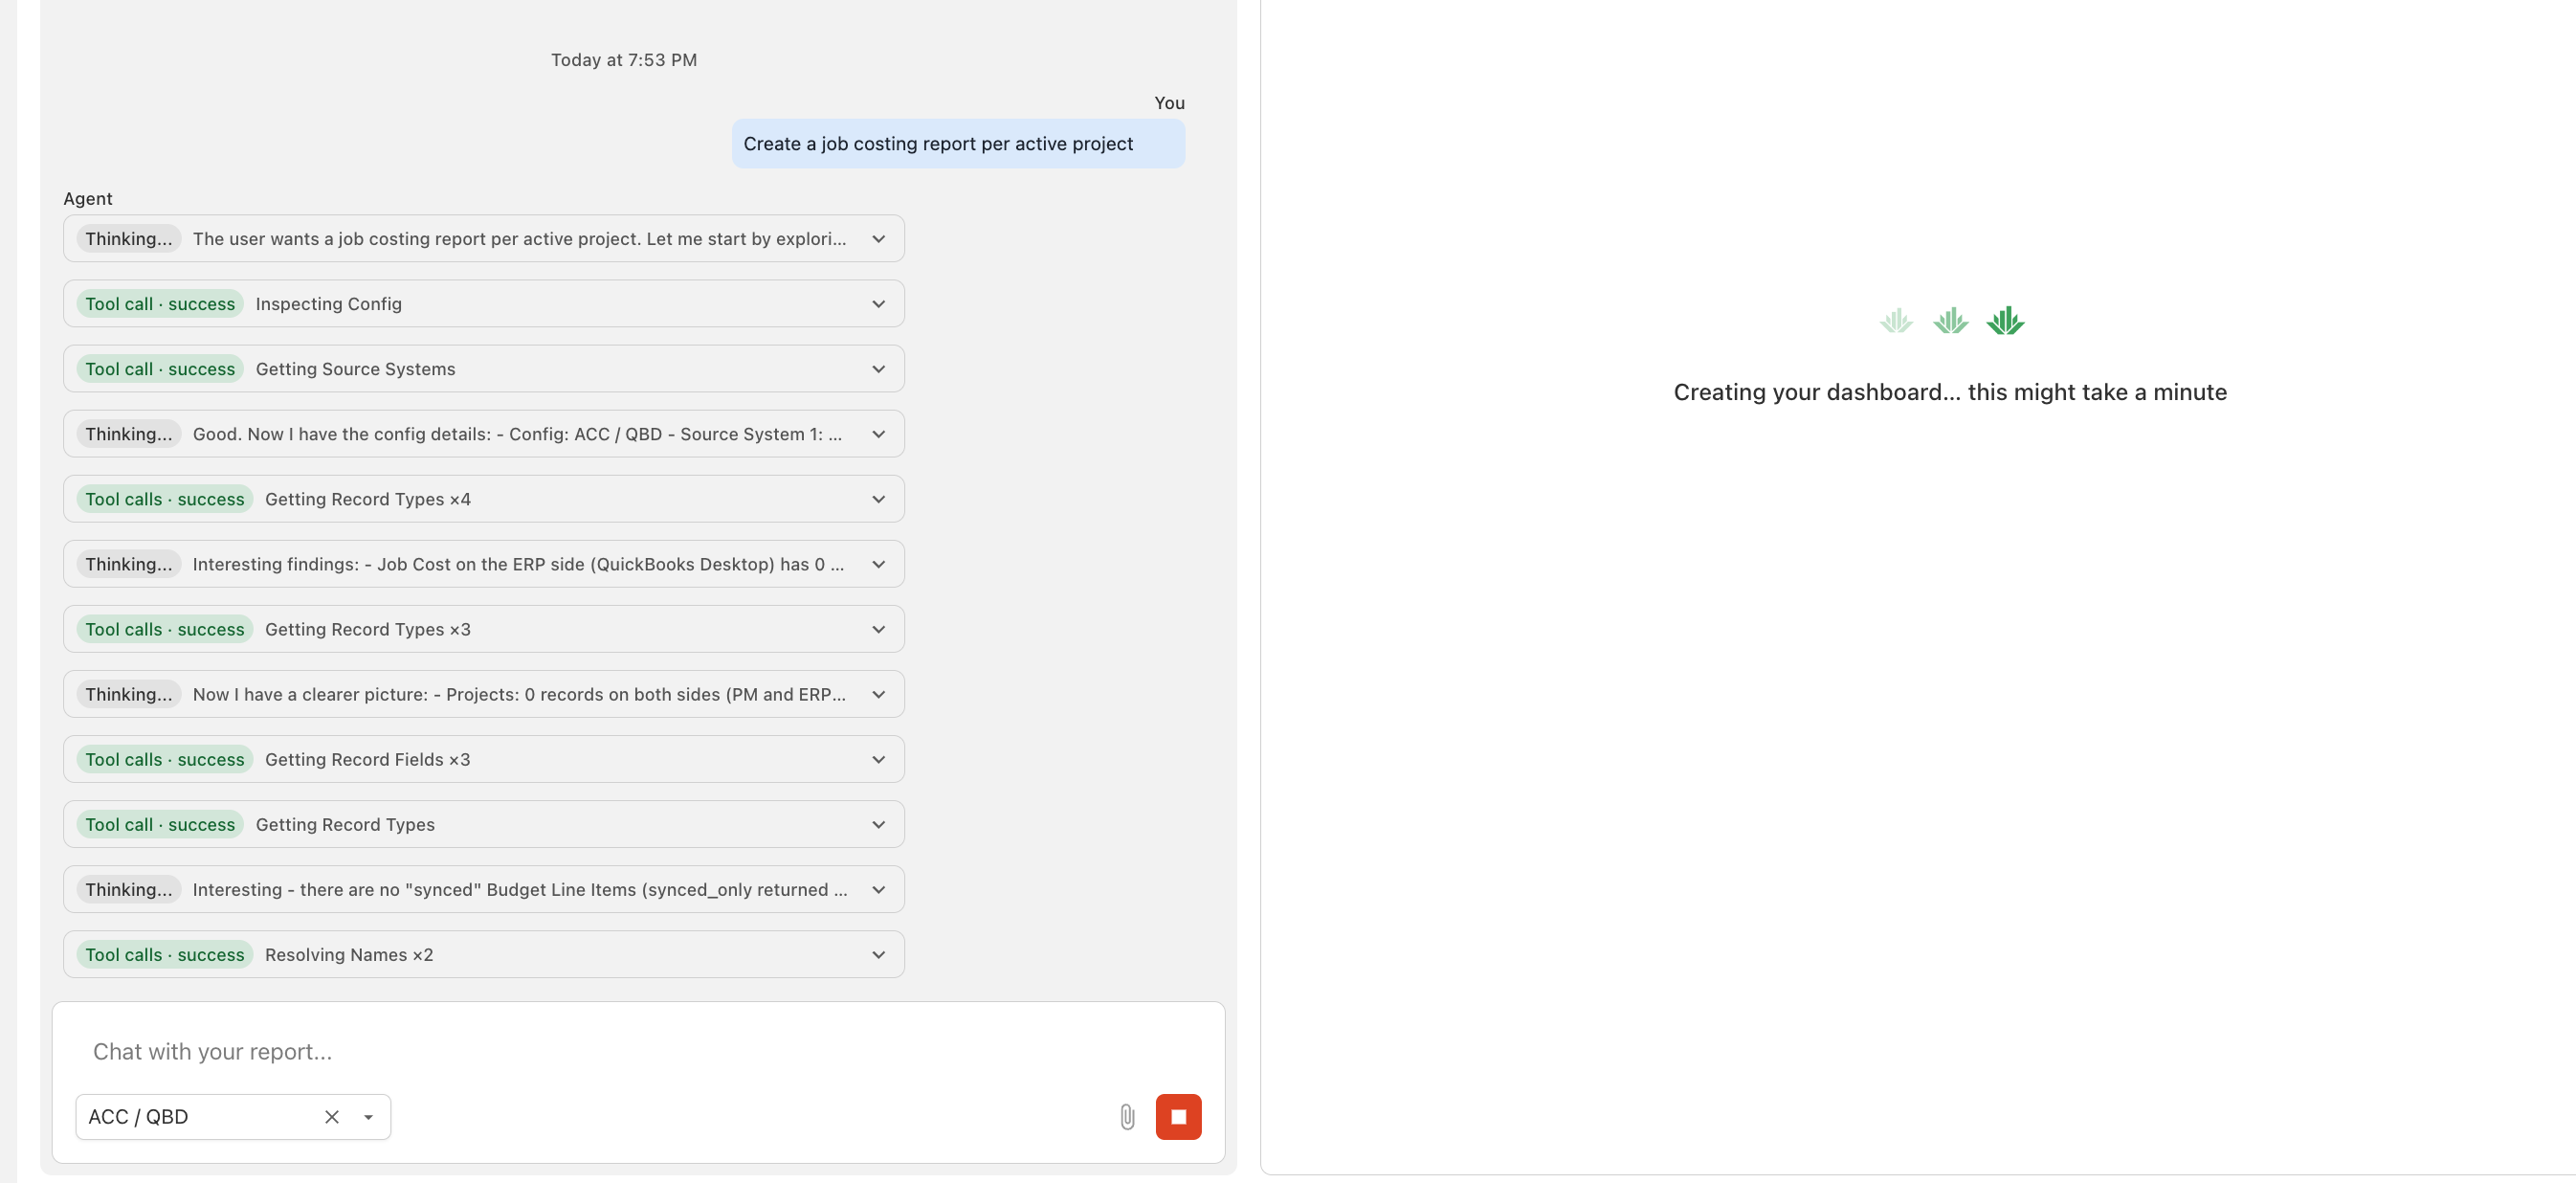
Build reports by prompting Agnes
Create a report, describe what you want ("Budgets vs Actuals for each Job"), and watch Agnes plan, query your data, and generate an interactive dashboard — with its reasoning and each data step shown live as it works. Refine the result by continuing the conversation. Learn more →
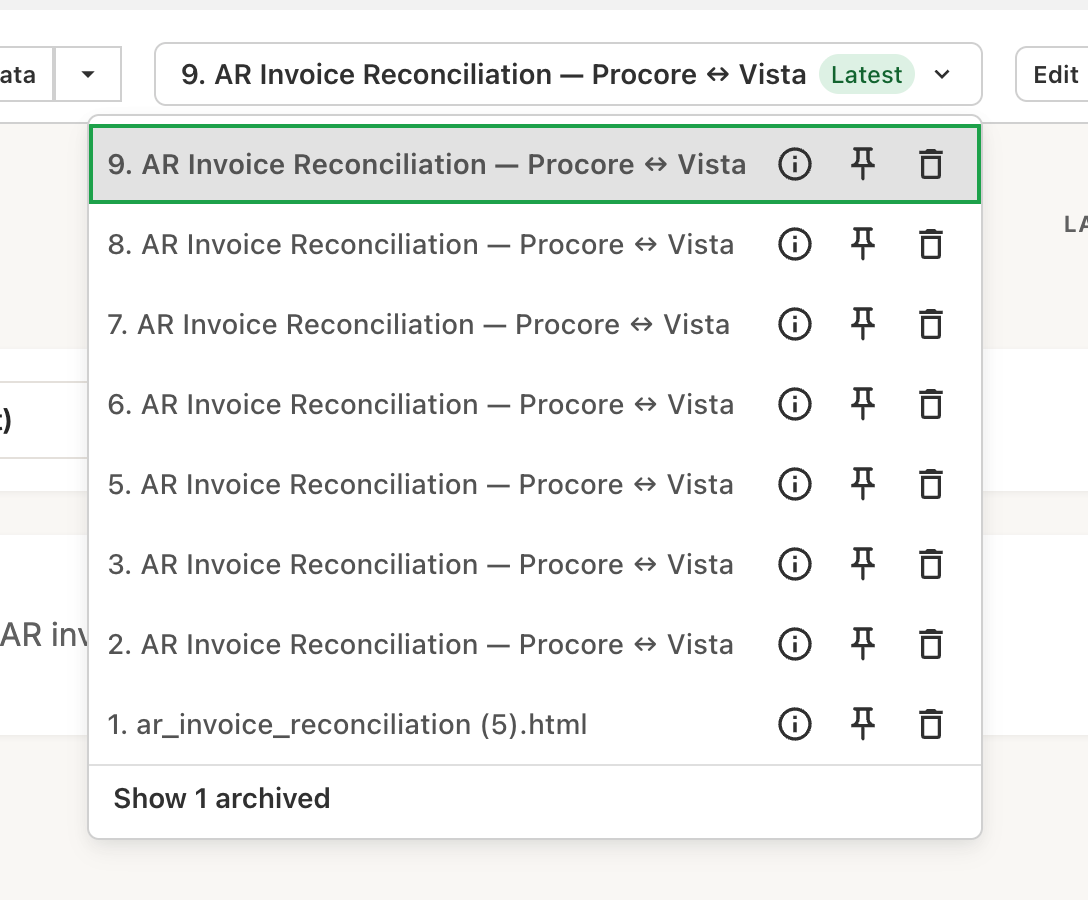
Version history
Every edit creates a new version, so nothing is lost by iterating. Compare versions, archive the ones you don't need, and pin a default version to control exactly what your team sees while you keep improving the report. Learn more →
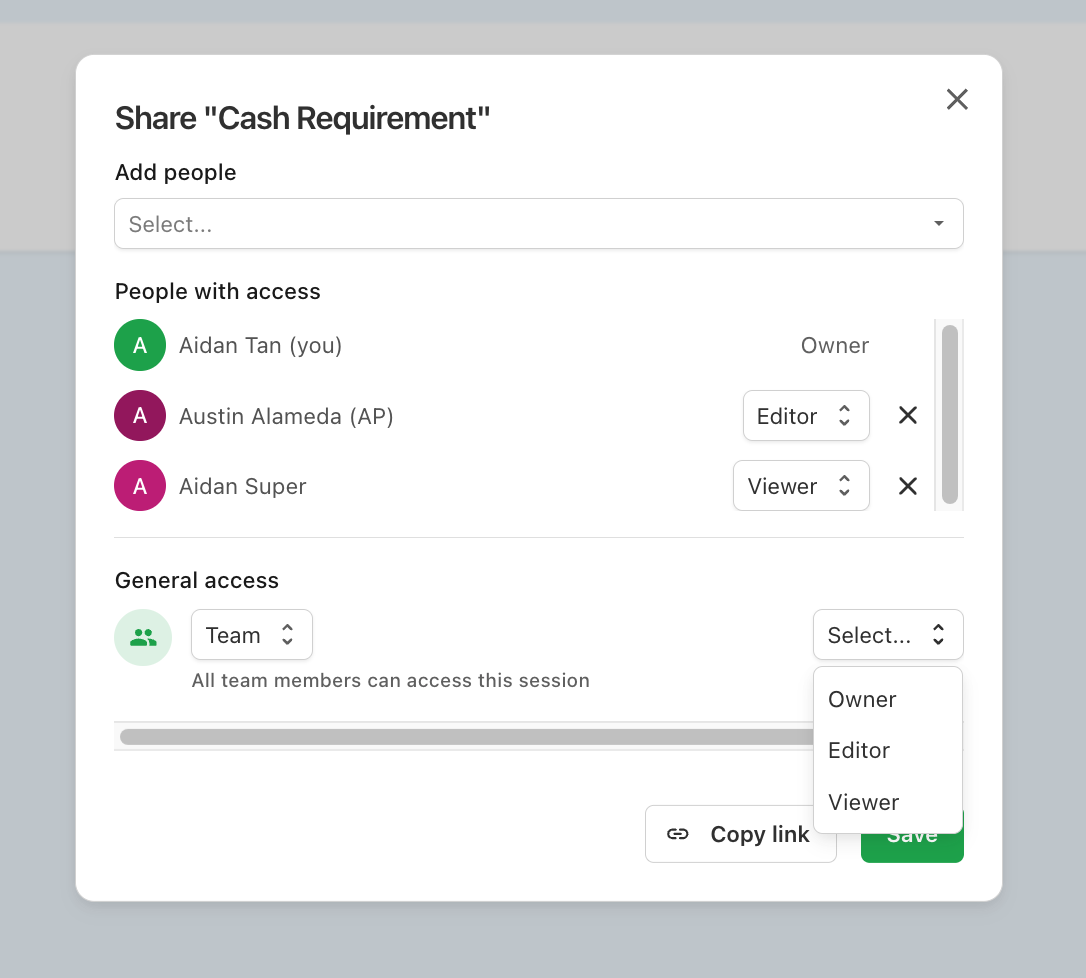
Sharing & permissions
Share reports with specific teammates or your whole team, with Owner, Editor, and Viewer roles controlling who can edit and who can only view. Learn more →
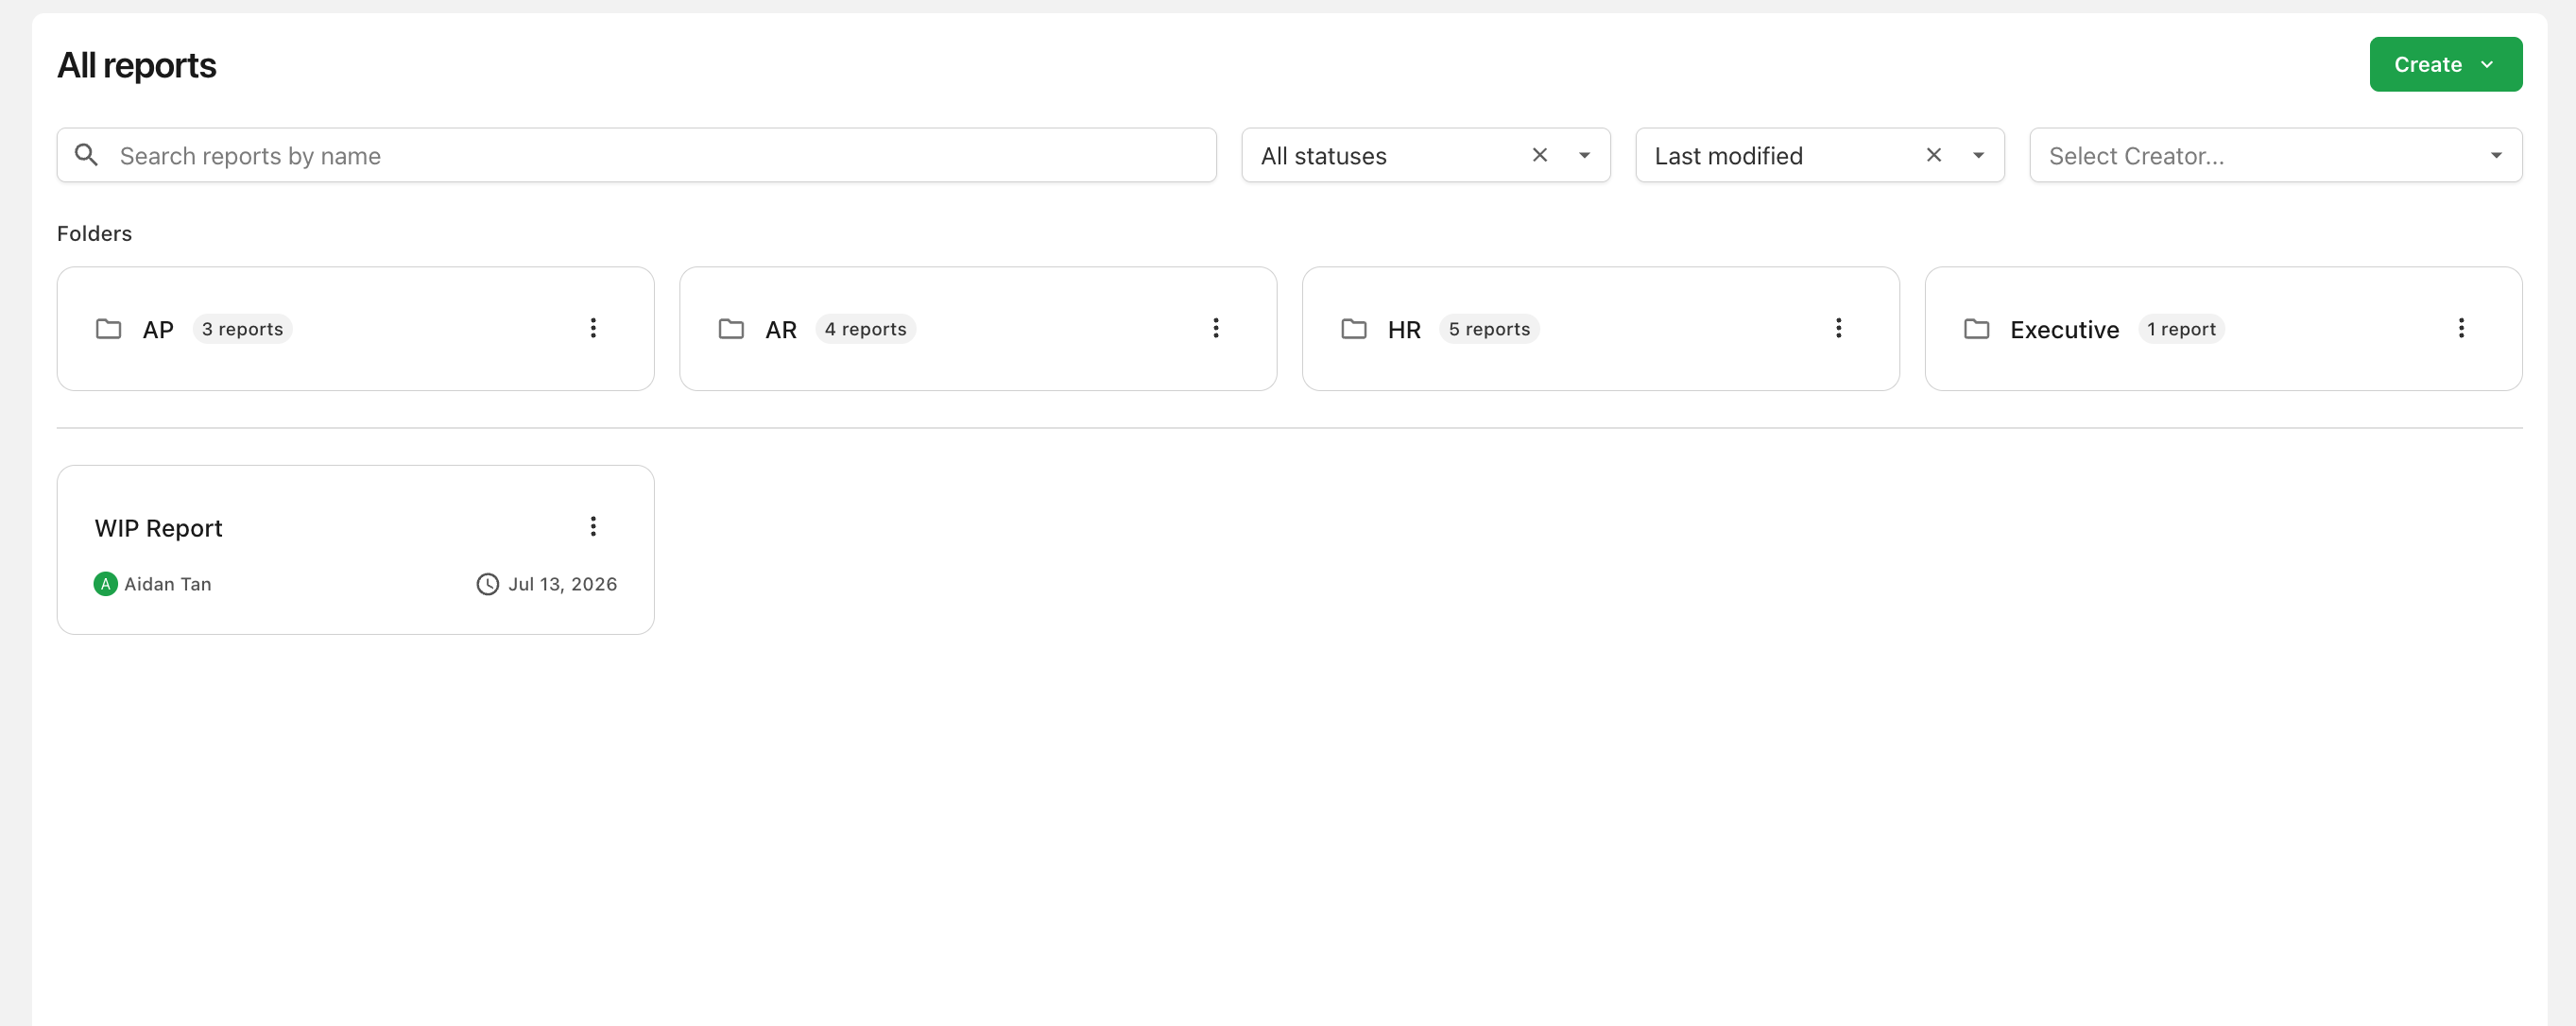
Folders and starring
Organize your team's reports into shared folders, and star the reports you use most for quick access from your personal Starred list. Learn more →